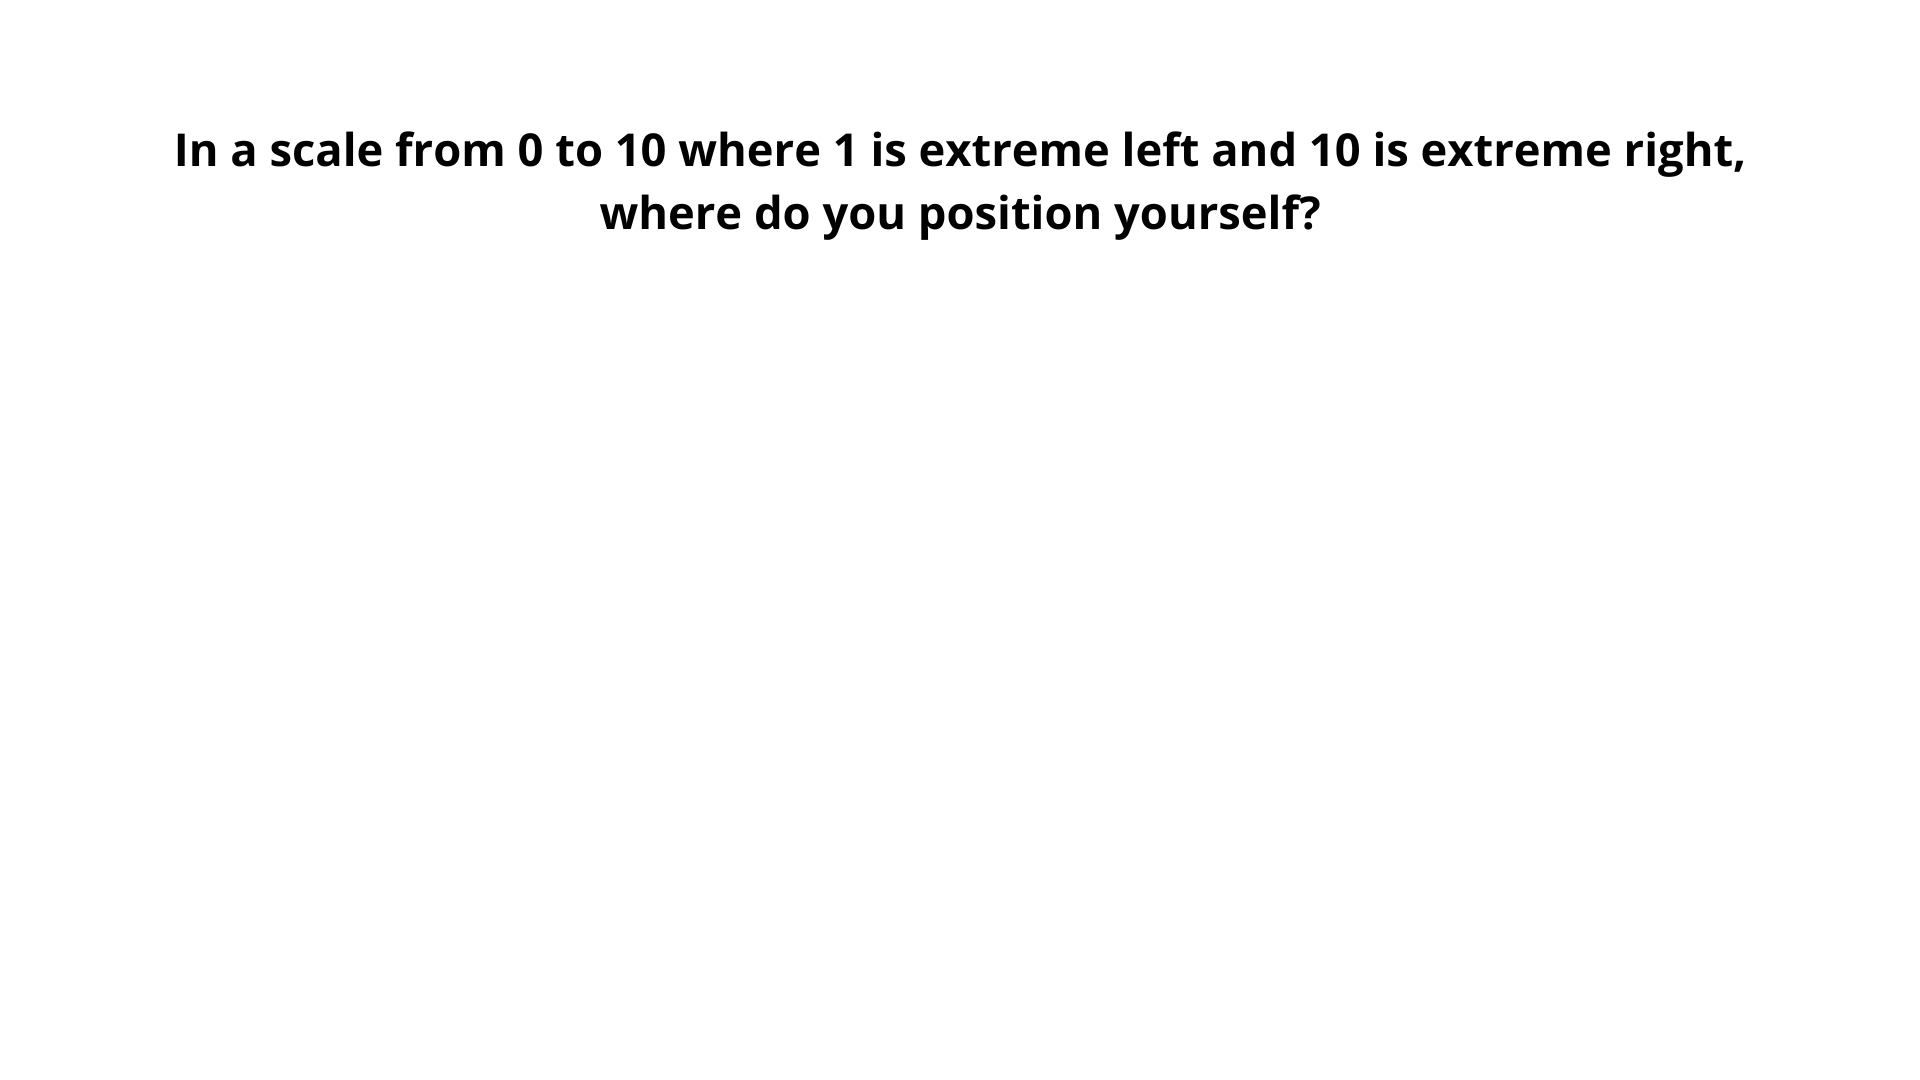
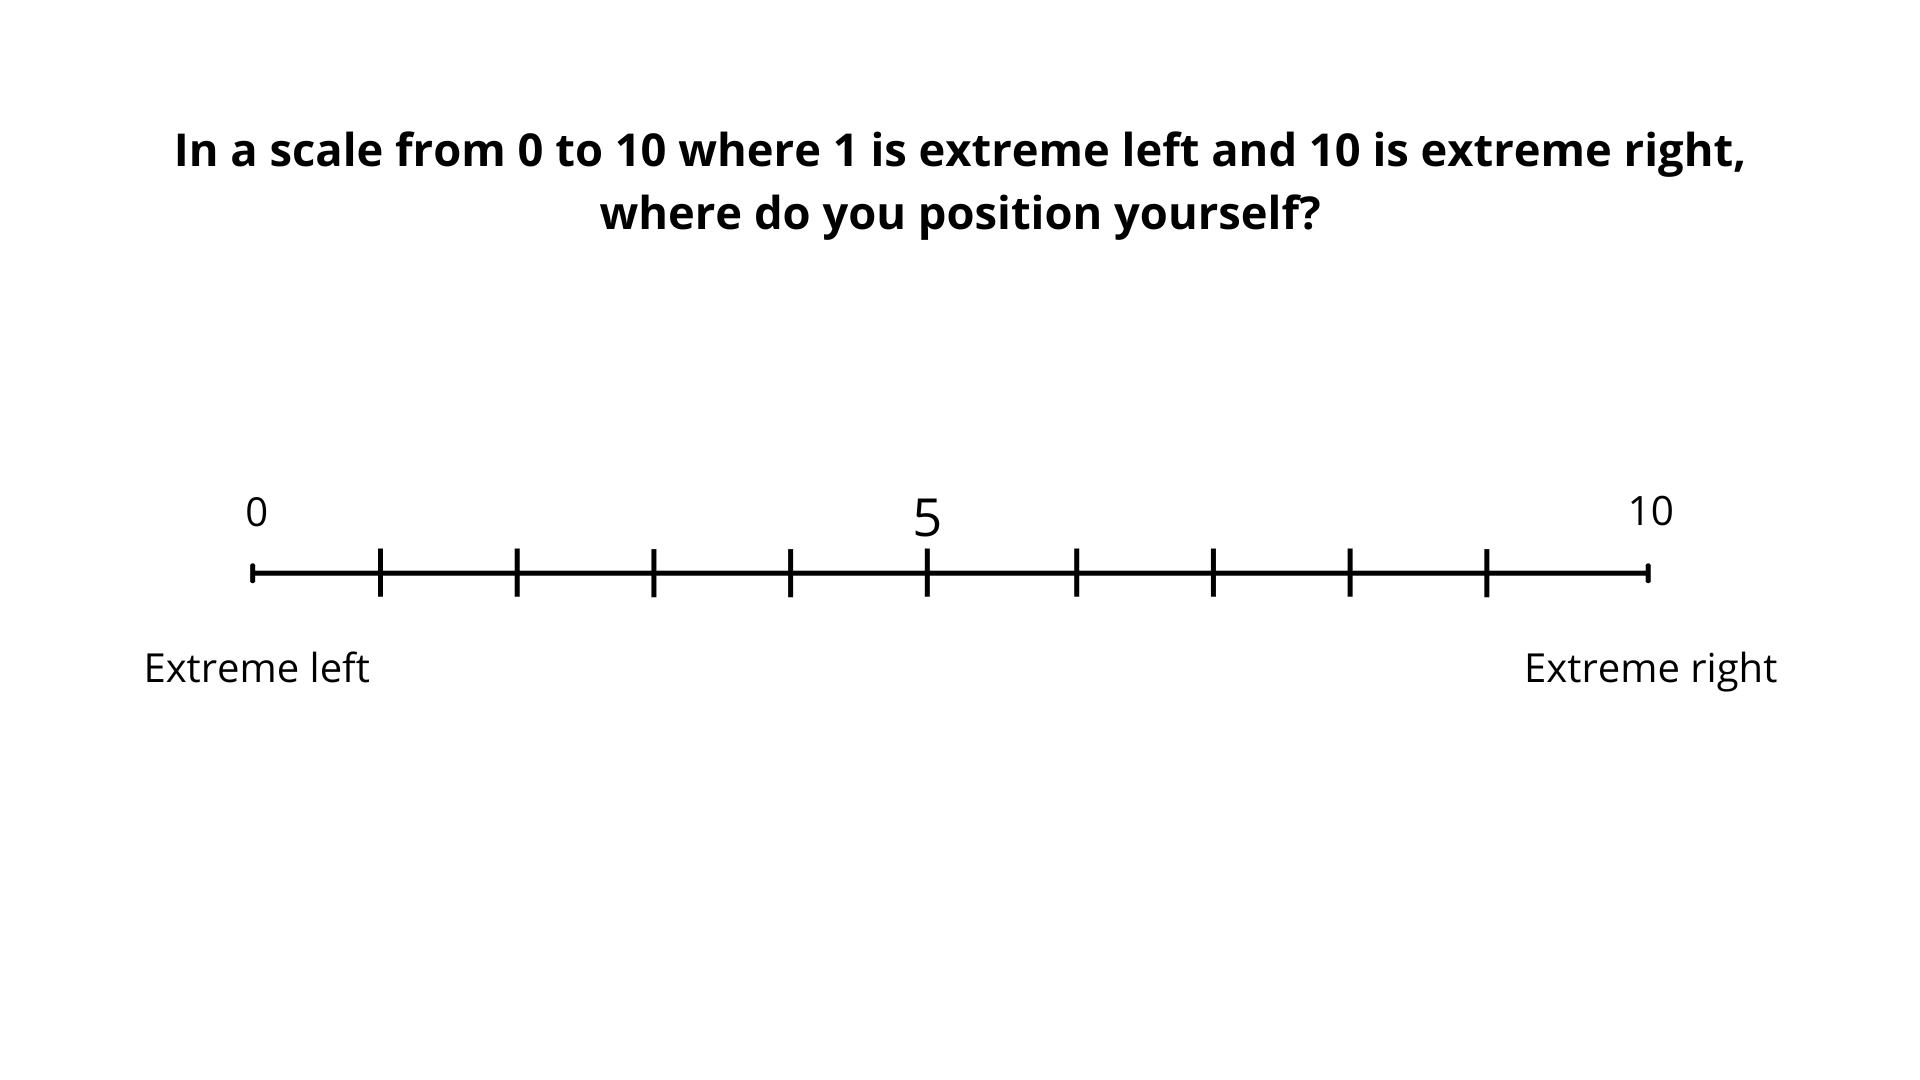
Not All Moderates Are Equal
Clickstream Evidence from Argentina’s 2021 Election
May 6, 2024

What the literature said so far?
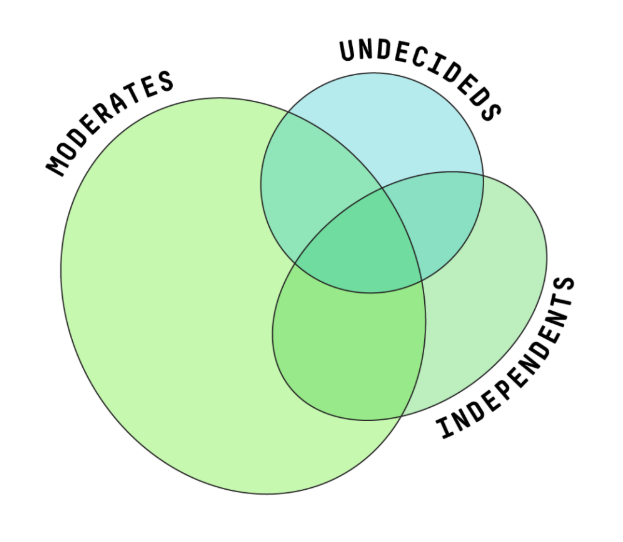
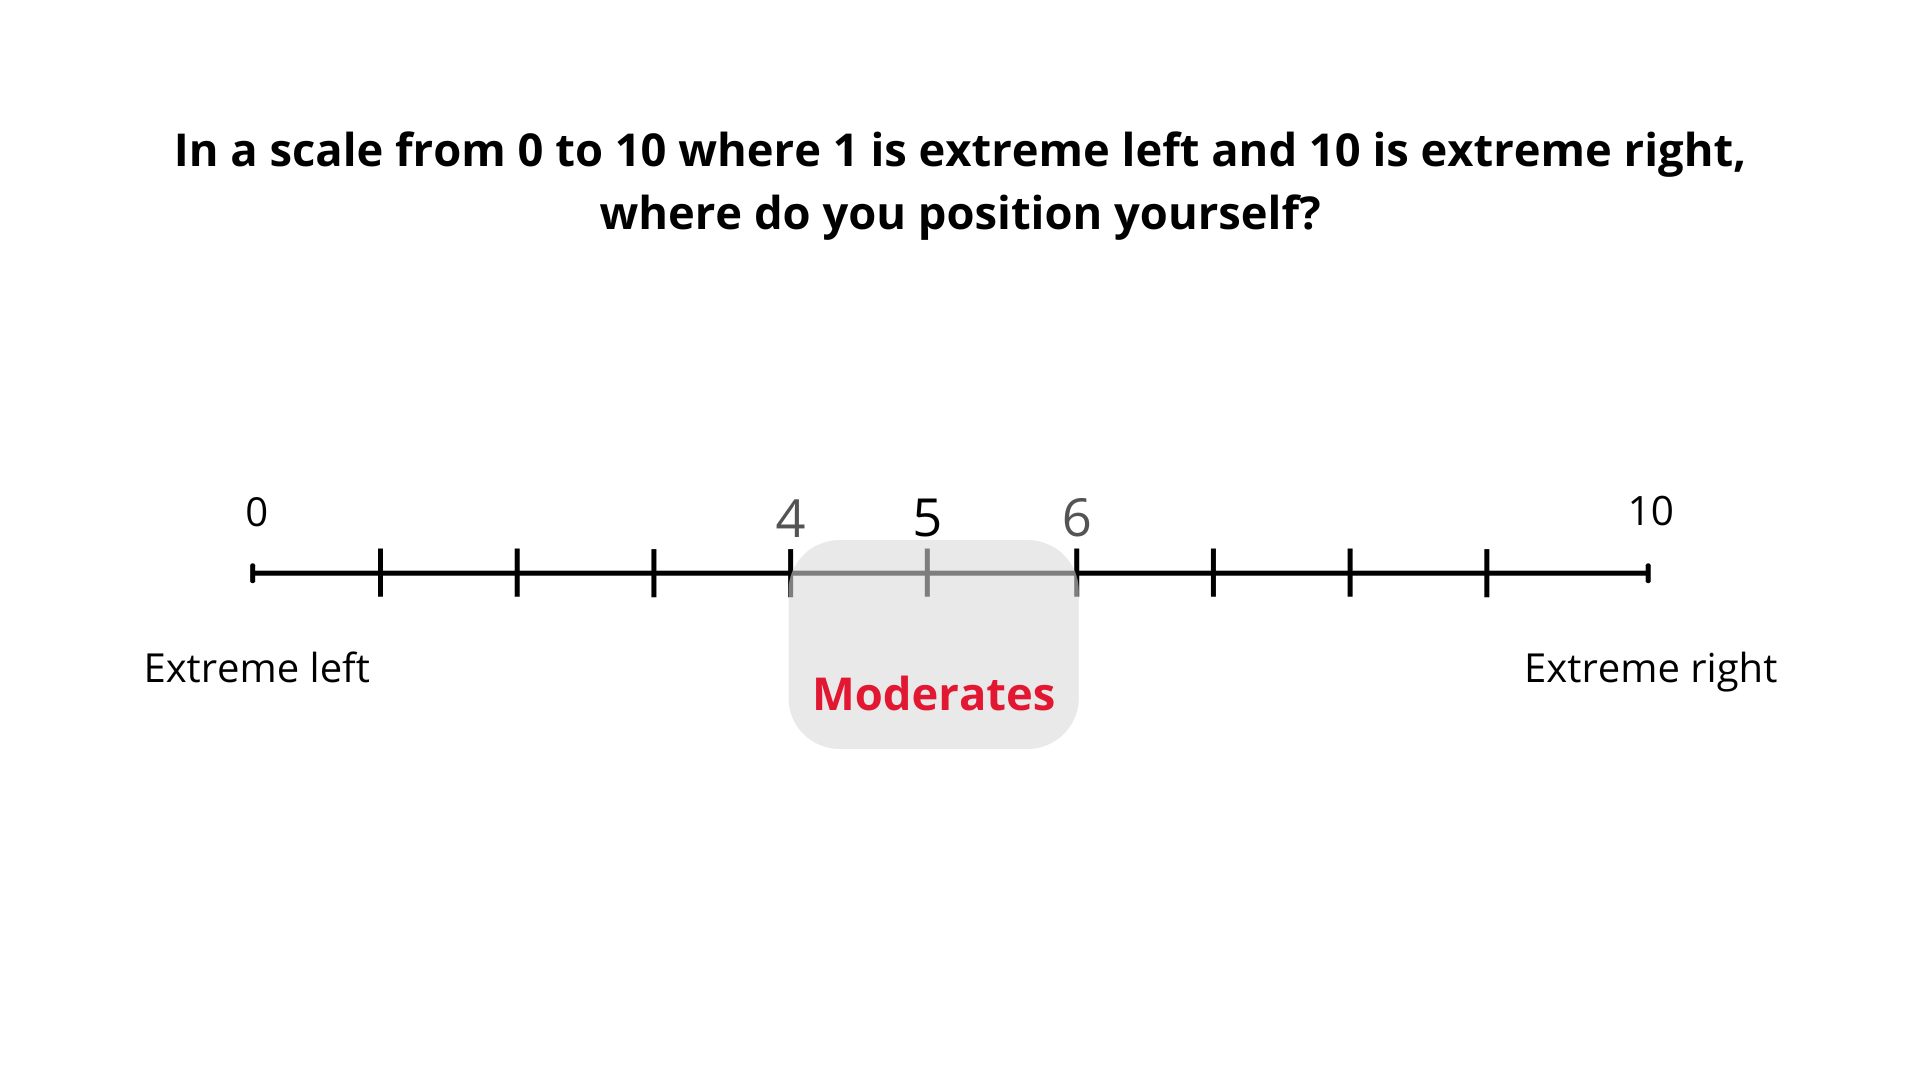
Campbell et al. (1960) establish that Moderates and independents tend to show lower political interest, less information, and more unstable attitudes…
Klar and Krupnikov (2016) shows that not all moderates are equal and we can distinguish between moderates that are interested in politics and moderates that are not.

Clickstream Data (Browsing History)
Clickstream Data (Browsing History)
Clickstream Data (Browsing History)
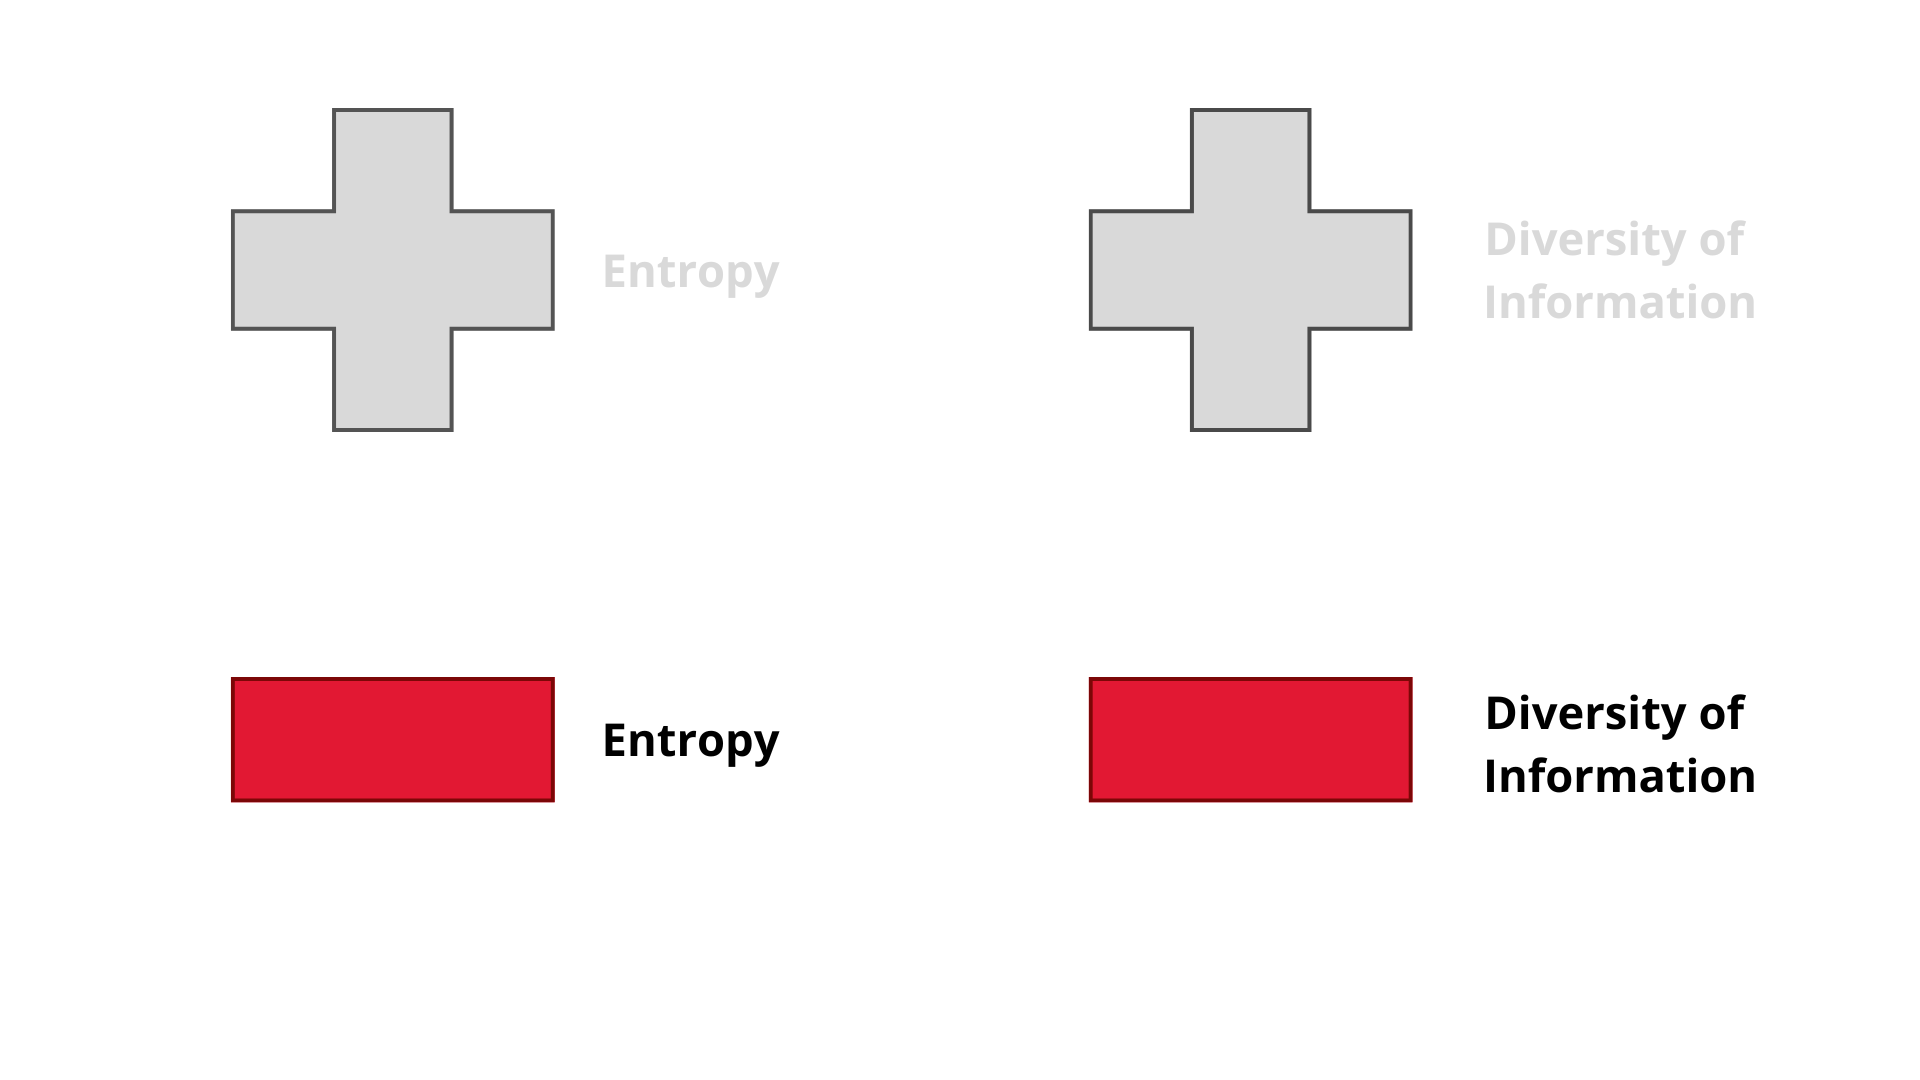
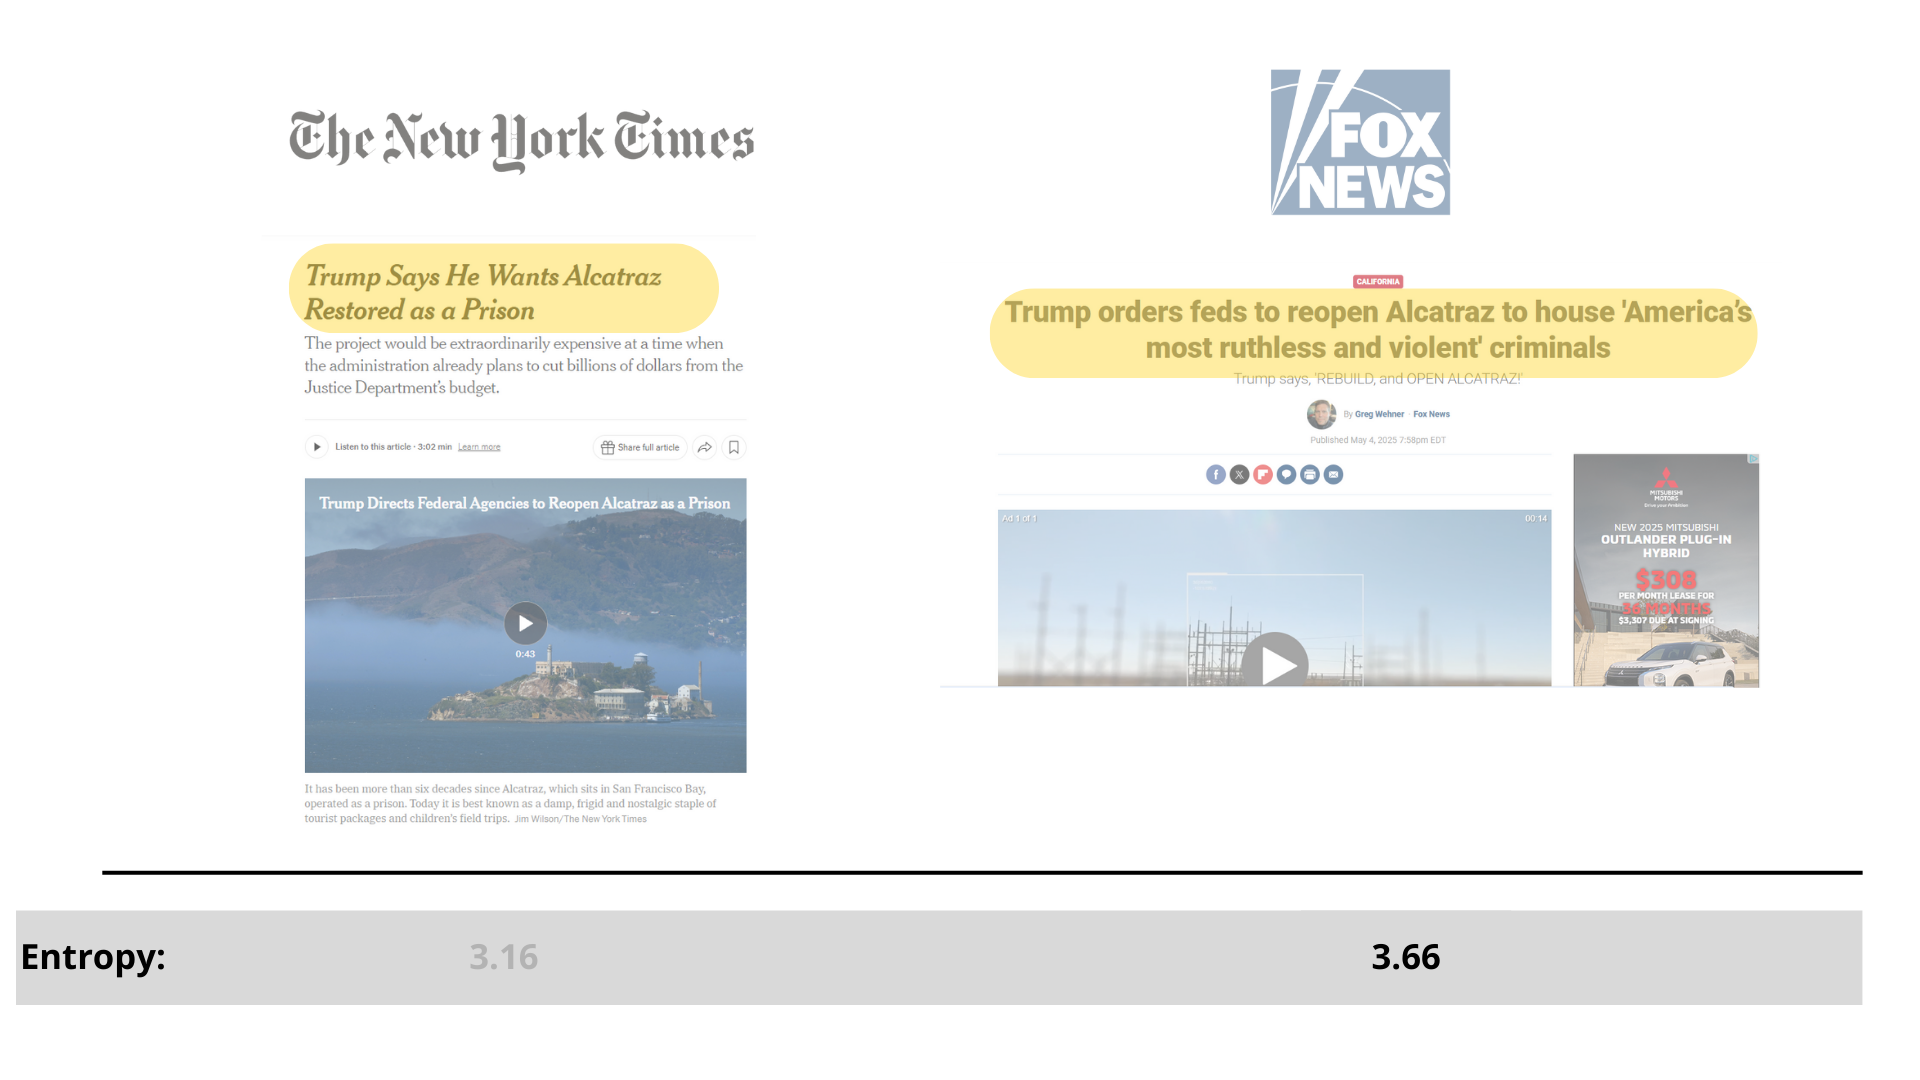
How can we measure how much informative it is a text?


For Example…


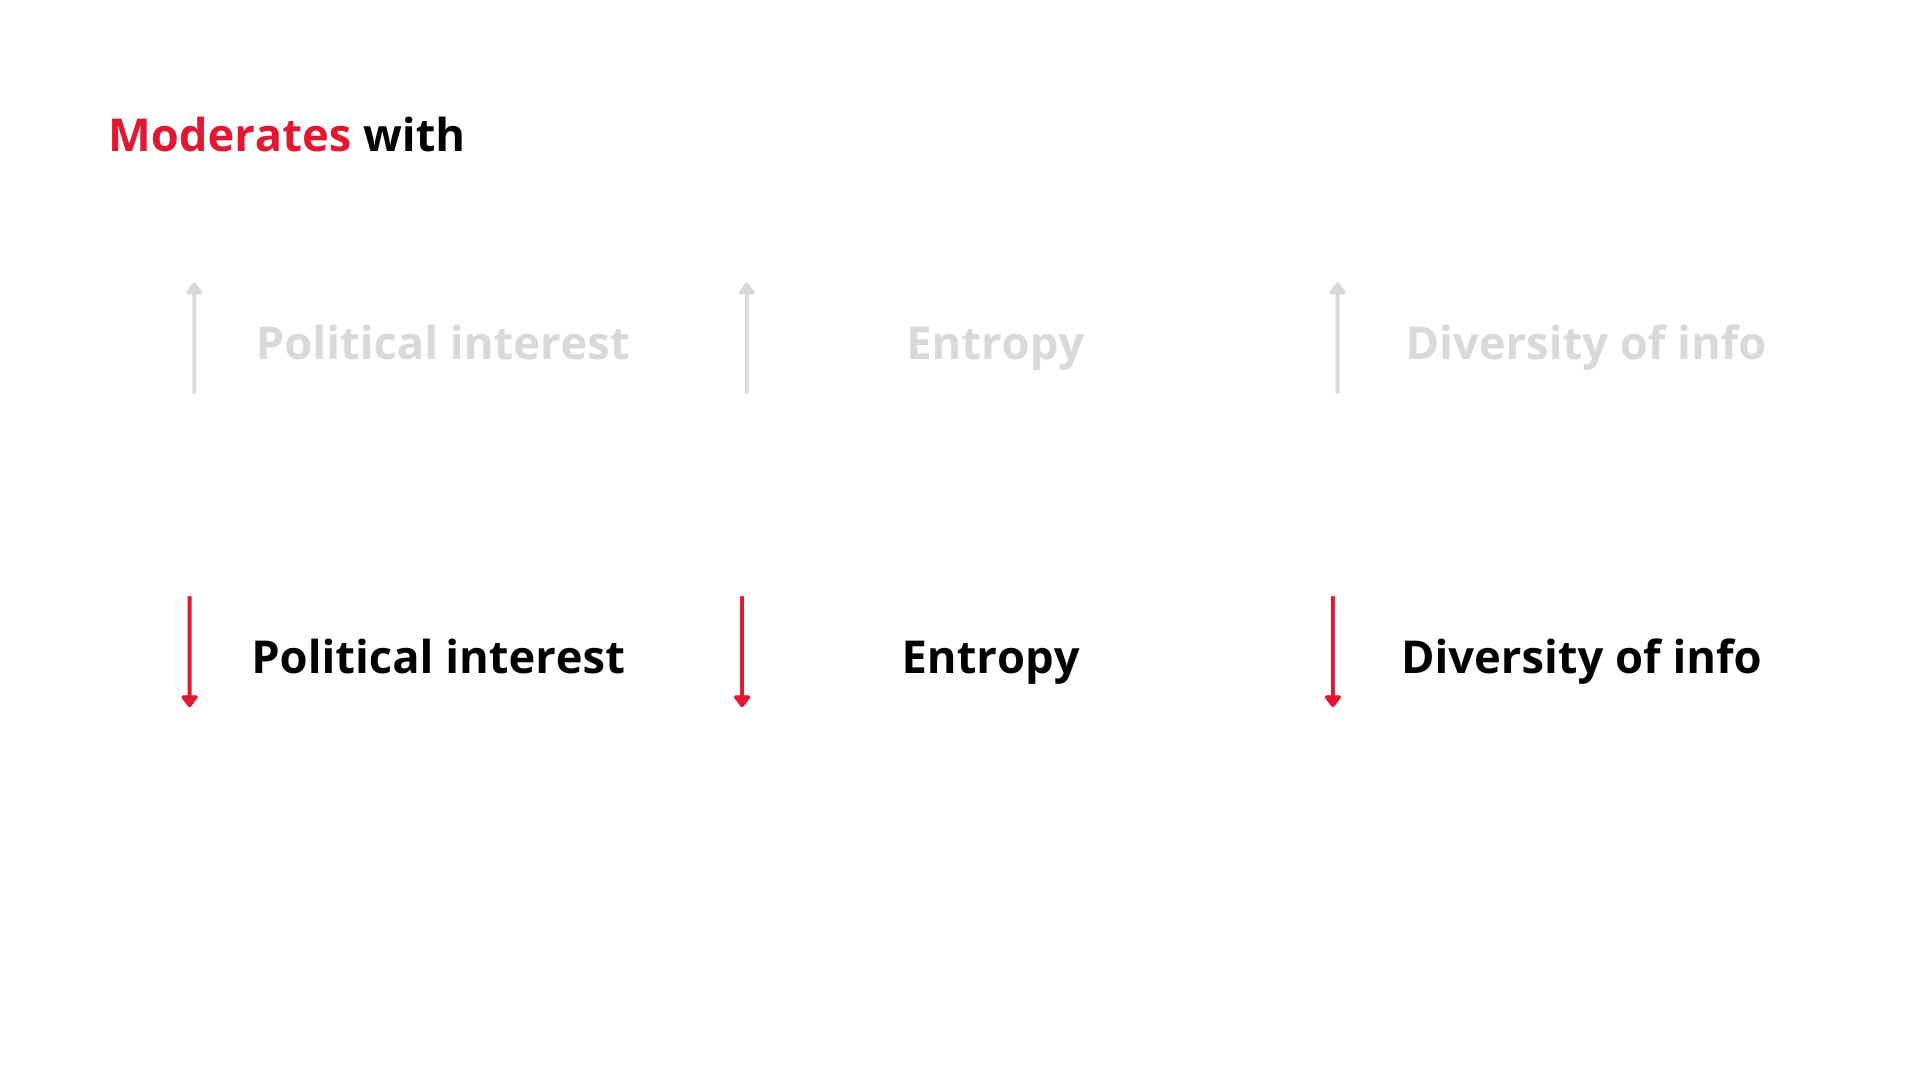
So, we can expect that…
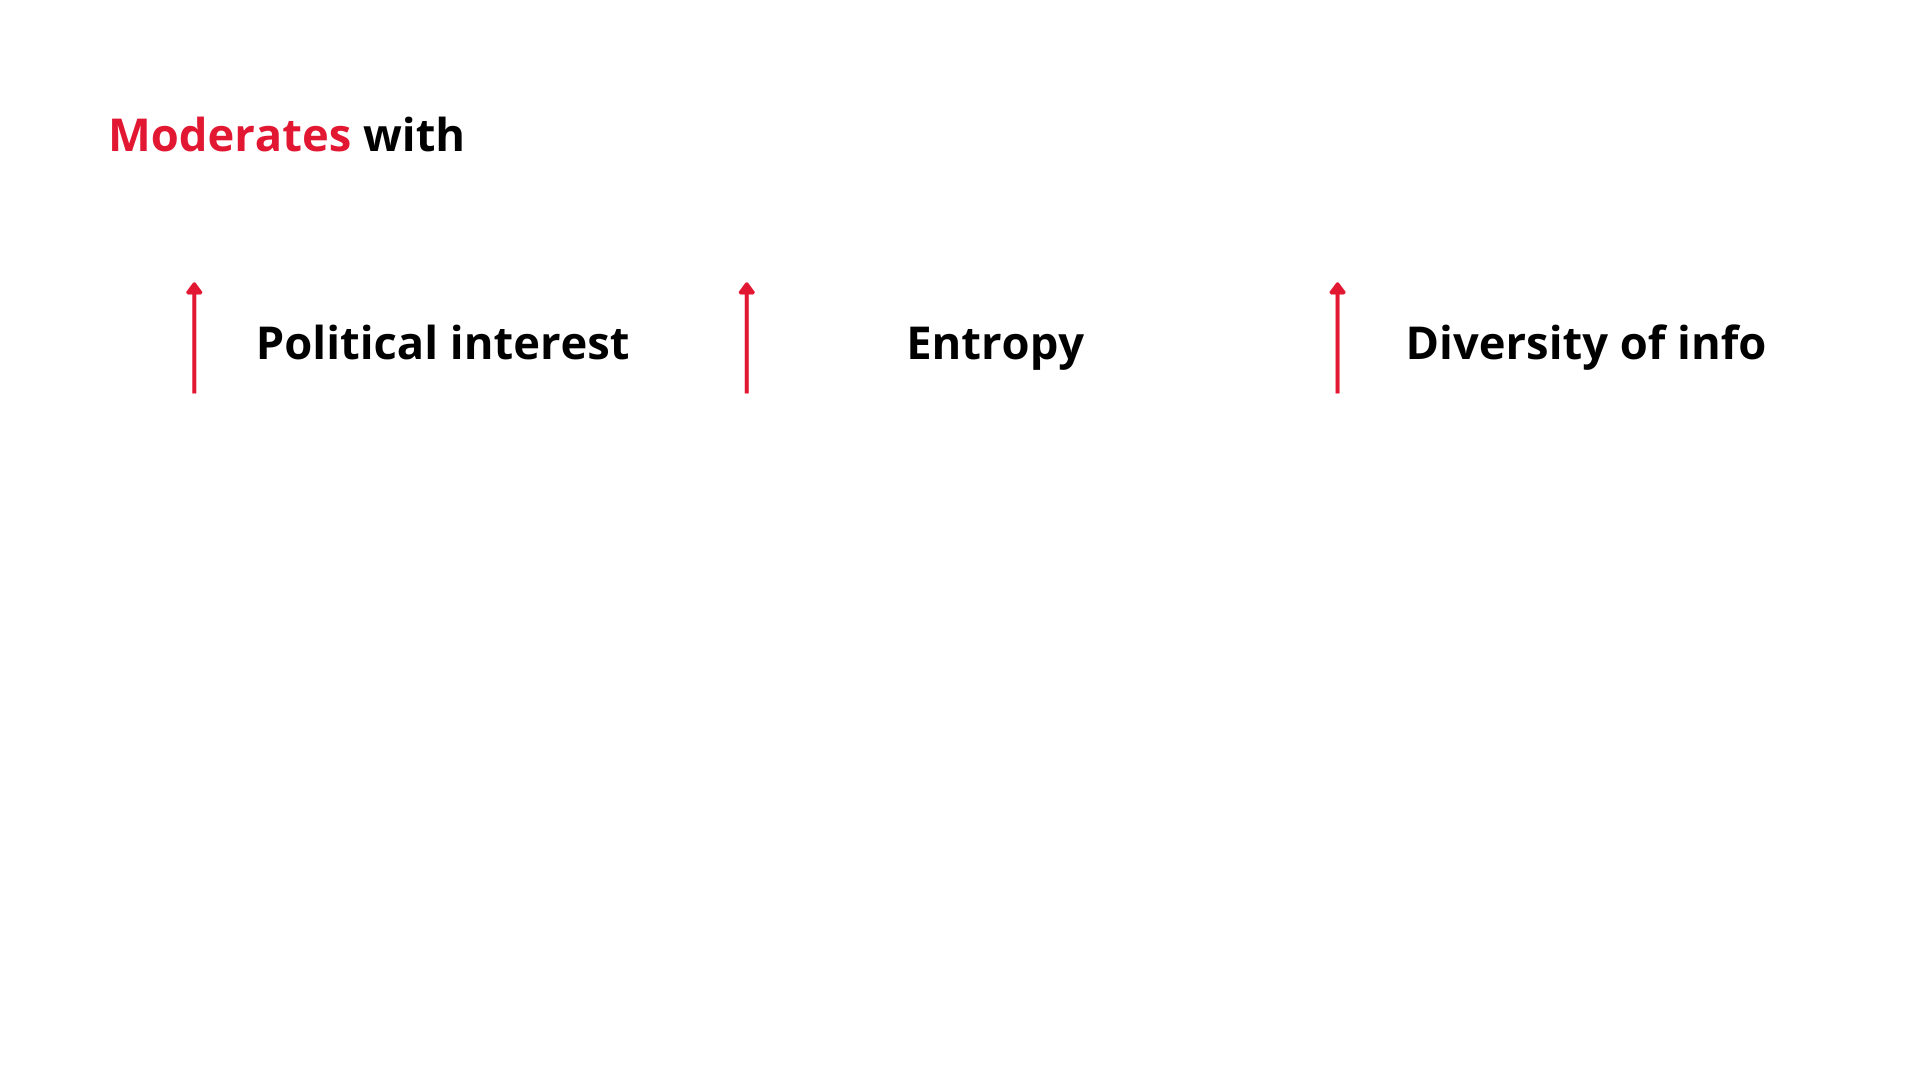
So, we can expect that…
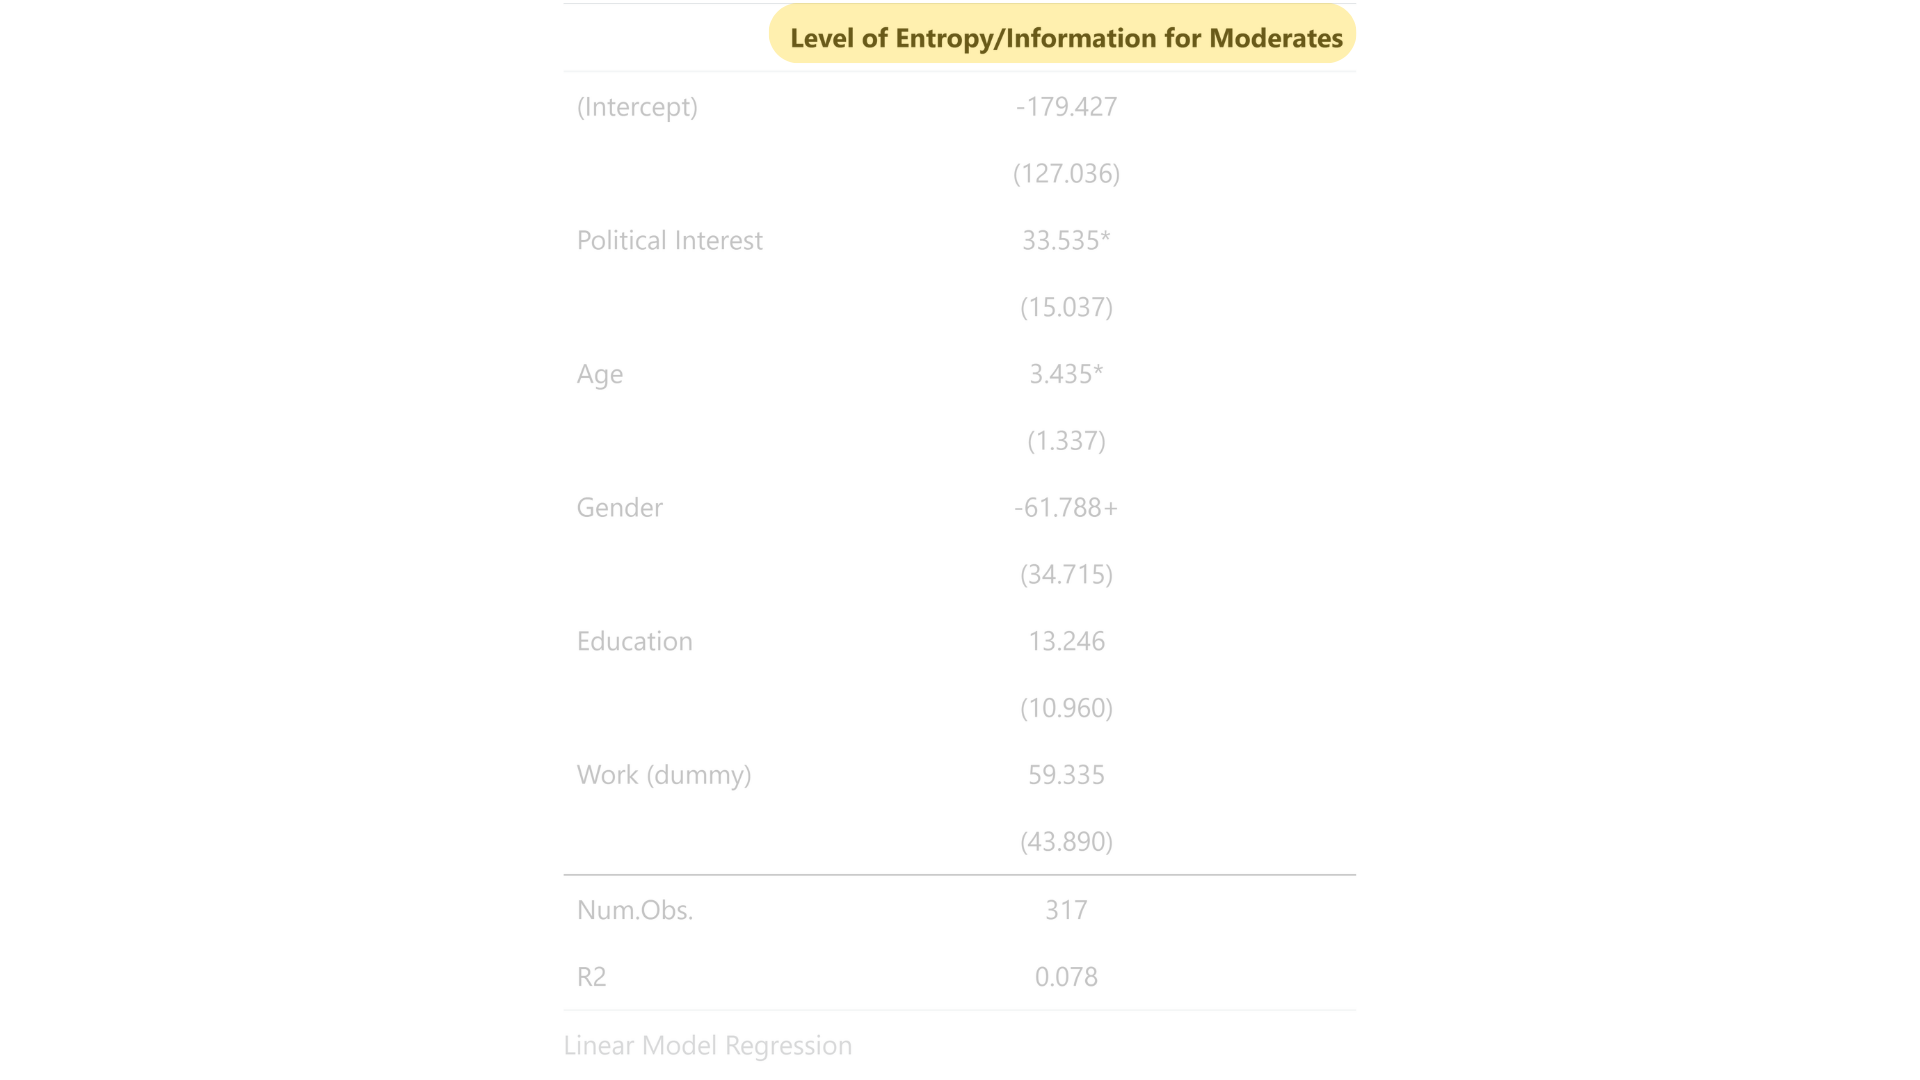
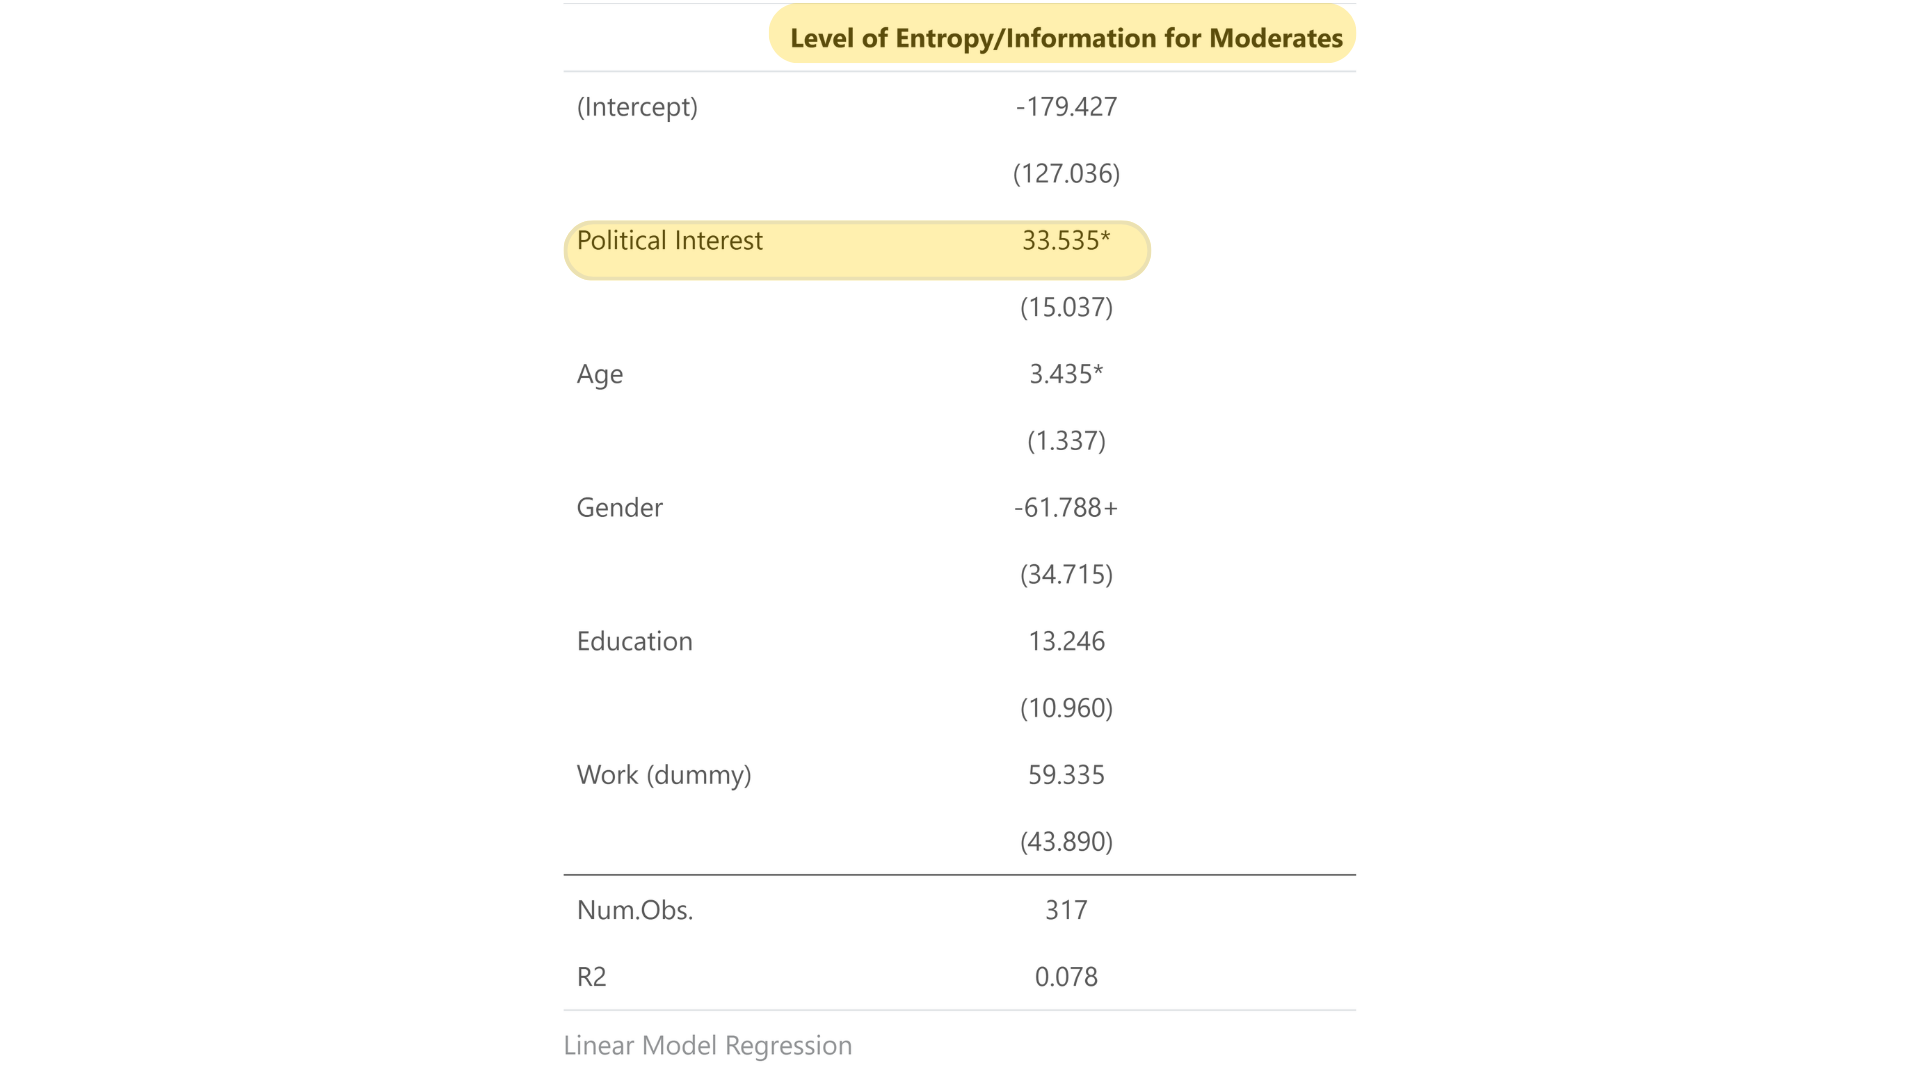
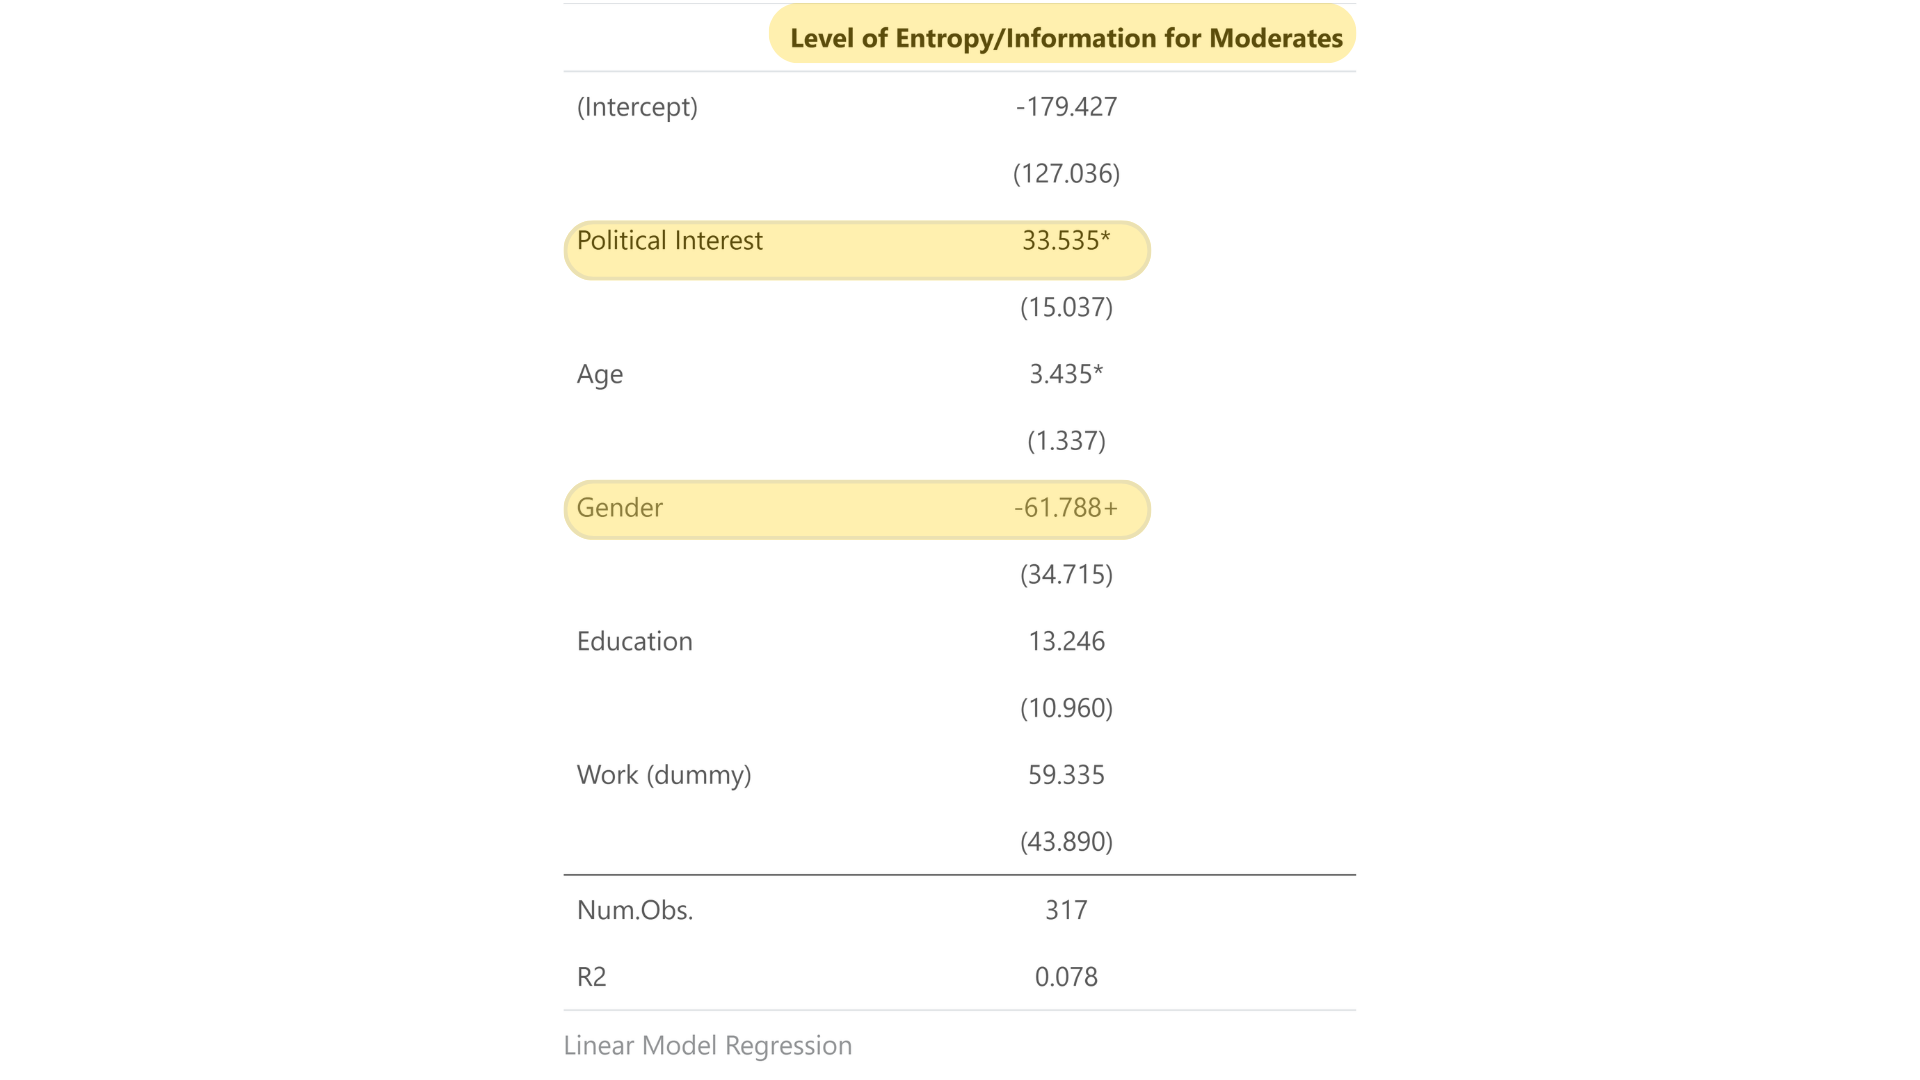
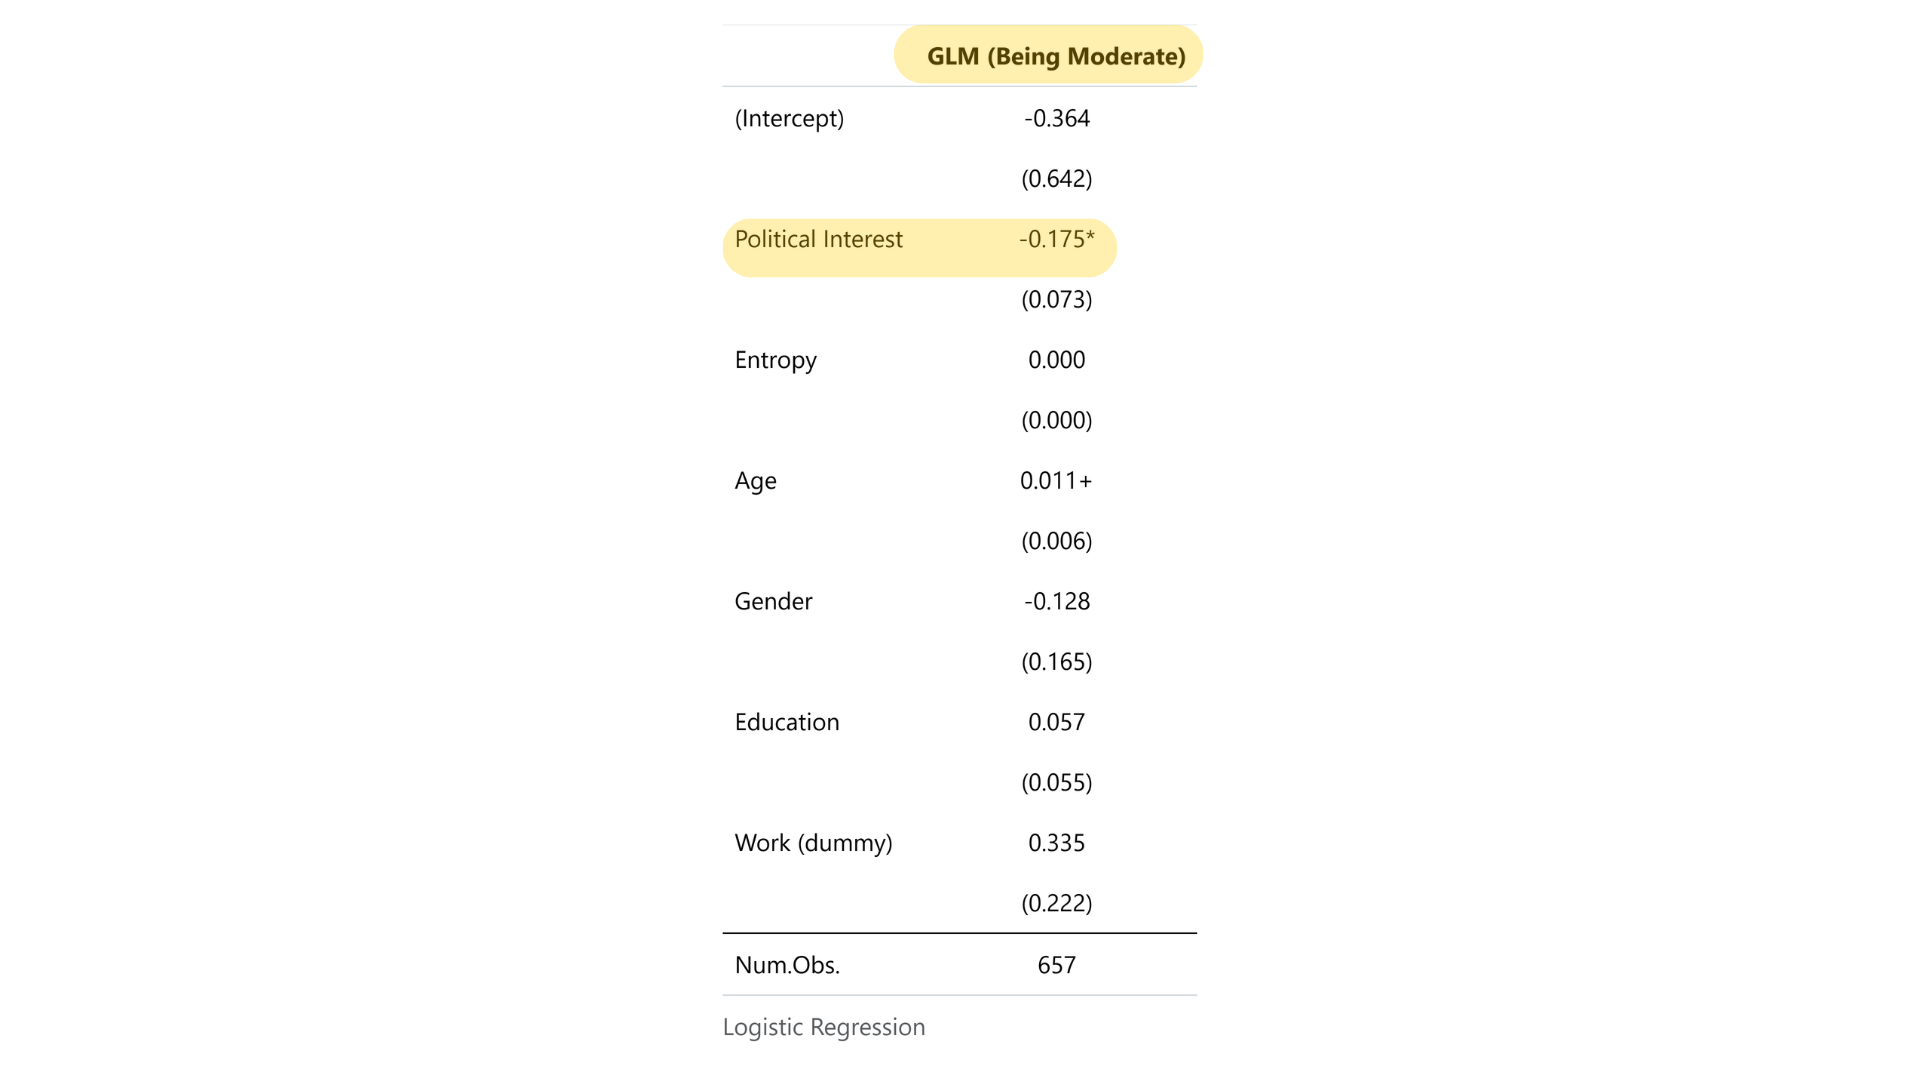
Some (parcial) results…
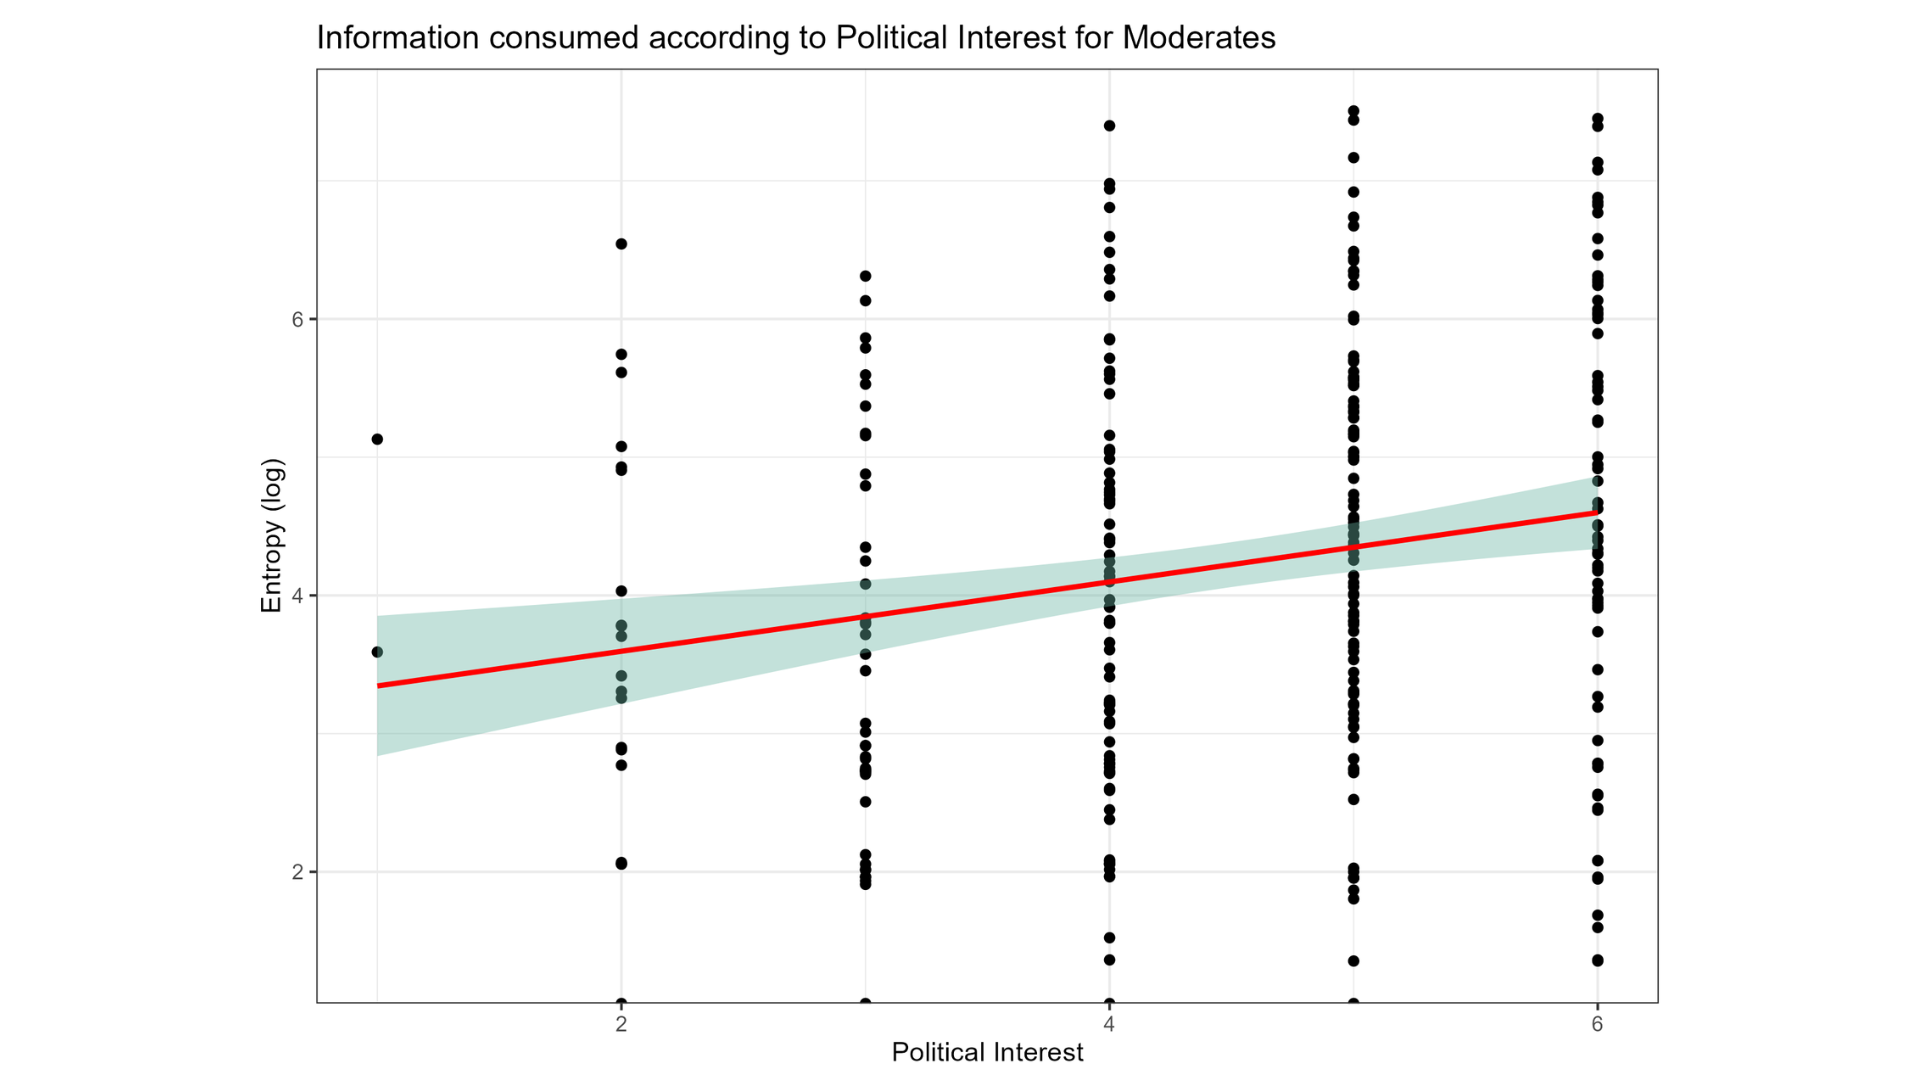
Regression in a plot
Regression in a plot
Appendix
Not All Moderates Are Equal